Setting the Standard for Research and Discovery
The engine of discovery at St. Jude is powered by some of the brightest minds in science and medicine, equipped with world-class resources and driven by the shared mission of advancing cures. We dream big and build our research programs to match.
St. Jude is committed to leveraging its assets to accelerate progress and maximize impact for children in Memphis and around the globe with an acute focus on fundamental science, childhood cancer, pediatric catastrophic disease, global impact, and workforce and environment. St. Jude has, and will continue to, significantly influence the way the world understands and treats childhood cancer, sickle cell disease, neurological disorders, and infectious diseases.


Explore our research
The St. Jude environment facilitates interaction among laboratory scientists and clinical investigators, promoting the translation of new findings from the lab to the clinic and communicating clinical problems to laboratory scientists for further investigation. Our 22 academic departments are home to more than 120 fundamental and translational research labs that bring the ‘bench to the bedside,’ ensuring that patients treated at St. Jude benefit fully from advances in our understanding of pediatric catastrophic diseases and their treatment.
Explore the work of our lab-based investigators by searching for a PI/Faculty name.
What sets St. Jude apart?


Unrivaled shared resources
St. Jude has over 20 core facilities and research resources that provide expertise and cutting-edge technologies to support collaborative work across the institution.

Careers & training
Answer your calling at St. Jude
St. Jude is a community of diverse faculty, staff, and trainees who strive to ask bold questions, create innovative solutions, and strengthen the robust scientific enterprise. St. Jude investigators have the freedom to focus on making big discoveries, backed by extraordinary resources and support teams.
Progress: A Digital Magazine
Sharing stories of impact and discovery across the St. Jude research enterprise.
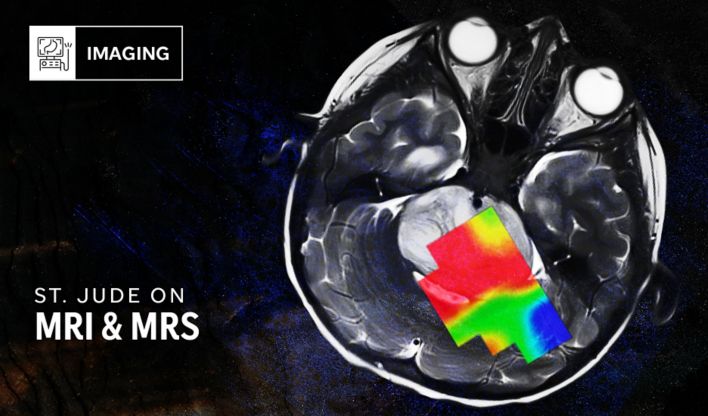
Learn how MRI is being used for metabolic imaging.

A St. Jude retrospective study reveals why pediatric cancer treatment should continue during COVID cases.

Histology is a mainstay of medical imaging, providing important insight into cancer and other diseases.

See how G3BP inhibitors represent turning point in RNP granule research
An extraordinary academic institution
Learn how a degree from the St. Jude Children’s Research Hospital Graduate School of Biomedical Sciences can help you further your science and make a difference.
With world-class basic and translational research, mentorship from internationally renowned faculty and exceptional support and resources, our degree programs offer a unique experience for all our students.

Memphis, TN, 38105-3678 USA GET DIRECTIONS